A leading researcher in mathematics education is warning about the pitfalls of over-emphasising the importance of the National Assessment Plan of Literacy and Numeracy (NAPLAN).
Charles Sturt University’s (CSU) Professor of Education Tom Lowrie says his four-year study of students from primary schools has revealed that the representation of the task - and particularly the graphics embedded within numeracy tasks - significantly impact student performance.
“A picture may tell a thousand words, so it in imperative that students understand what each picture means,” Professor Lowrie explained.
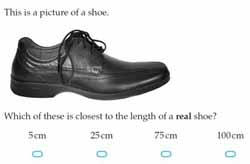
“Take the following NAPLAN task as an example. We found there were significant differences in the performance of primary students on the two questions below, even though they are essentially asking the same thing. Fifteen per cent more students gave the correct answer when they solved the non-NAPLAN task — the one where the shoe graphic was removed in Example B. What do you think is the correct answer?” [See the Media Note below]
Example A:

Example B:

Professor Lowrie and his colleagues’ (including doctoral candidate Ms Jane Greenlees) research findings highlight many instances where the modification of a graphic significantly changes the task complexity.
“It is essential that teachers explicitly teach the role of information and contextual graphics embedded in mathematics tasks since they directly or indirectly bring meaning to the tasks”.
Graphs, maps, charts and diagrams have become an increasingly important part of mathematics assessments and dominate national ‘high stakes testing’ programs such as the NAPLAN.
“In the information age, our society has become increasingly reliant on the representation of information in graphical forms.
“The mathematics curricula for primary school children have followed this trend with assessment tasks more likely than ever to be in a graphic form. In fact, 70 per cent of items in the NAPLAN for students in Year 3 involve a graphic.
“This is in stark contrast to the limited use of graphs in previous basic skills testing.
“There is a need for test designers to carefully consider the graphics embedded within mathematics tasks since the elements within graphical tasks greatly influence student understanding. It is imperative that these assessment tasks are designed appropriately for accurate measurement.
“The entire education system’s reliance on NAPLAN results from the classroom level up must ring alarm bells given these findings.
“The results of the NAPLAN are now so public. This research shows they should not be regarded as ‘the be all and the end all’,” Professor Lowrie said.
The 2012 NAPLAN will be conducted for Years 3, 5, 7 and 9 from Tuesday 15 May to Thursday 17 May.
In a career that began as a primary school teacher in Sydney’s south-west, Professor Lowrie is now recognised internationally as a leading researcher in mathematics education. So far in 2012, Professor Lowrie has delivered presentations on this research in Western Australia, Queensland, London, The University of Manchester, Oxford University, and as visiting professor at University of California in Santa Barbara.
Professor Lowrie divides his time in research (he has secured a total of four Australian Research Council Discovery Grants since 2004 totaling over $980 000) and as Director of CSU’s Research Institute for Professional Practice, Learning and Education (RIPPLE) - a research centre charged with improving the practice of a variety of professions including teacher education.


Social
Explore the world of social